Finding a Way to Keep Up with My Ever-Growing Newsletter Inbox

Introduction
Friday morning, I wake up, and check my inbox—a daily reminder of the guilt from the mountain of unread newsletters.
This time, I really want to get it right, but I have ~2.3k unread emails, and new ones keep arriving regularly, so I need to plan this out.
I need to figure out how many emails I should read everyday to not only keep up with new newsletters, but to also catch up on the backlog.
Seeking advice
So as I usually do, I opened ChatGPT, Claude, and unusually, Grok, and gave them the same prompt:
I am subscribed to many email newsletters to learn more about software engineering, product building and some SEO stuff. But I am getting overwhelmed, my inbox is sitting at 2.3k emails, and I get sometimes daily and often weekly emails from multiple newsletters. How do you suggest I go through them?
I use Gmail, is there a way to get analytics on my inbox? Maybe I can set a daily target of emails to read, but I’ll need to know the amount of emails I am receiving
I was impressed by Grok’s answer, it linked me this relevant tweet:
I re-enabled the Forums tab (since I had removed it before), and it organized things a bit by grouping newsletters.
More importantly, both ChatGPT and Grok suggested me 3rd party tools to integrate with my inbox to give me insights on it, I tried one of them, Email Meter, but their features were limited, and I couldn’t query data flexibly. Plus, I wasn’t comfortable with a 3rd party application having access to my inbox.
Claude suggested that I use Gmail’s data filters, and it does come in handy. For example, to view the number of emails you received in February, use this search query: after:2024/02/01 before:2024/03/01, then keep navigating to the next search result page (if it exists) until you reach the last page, where you’ll finally see the total number of emails for that month.
It’s manual, it’s limited, and can involve a lot of clicking if you have a huge number of emails in the queried period. But it’s something, you end up with a number, which is a win.
My preferred approach
Additionally, ChatGPT suggested me the perfect approach for me, which is to use Google Takeout.
It’s a first-party tool from Google that allows you to download all kinds of data from your Google account. So I downloaded my entire inbox, and got an mbox file that includes my entire email history, including spam and trash. For reference, the mbox file was ~1GB of size.
At this point, I am super glad to have the entire inbox data to play around with however I wish, and that I did. Off I went to more prompting.
I ended up with a script that returns the total number of emails and total number of days, in addition to grouping the number of received emails by week and plotting the data in a line chart, and these are the results:
- Emails: 5,010
- Days: 1,746
- Average: ~3 emails/day
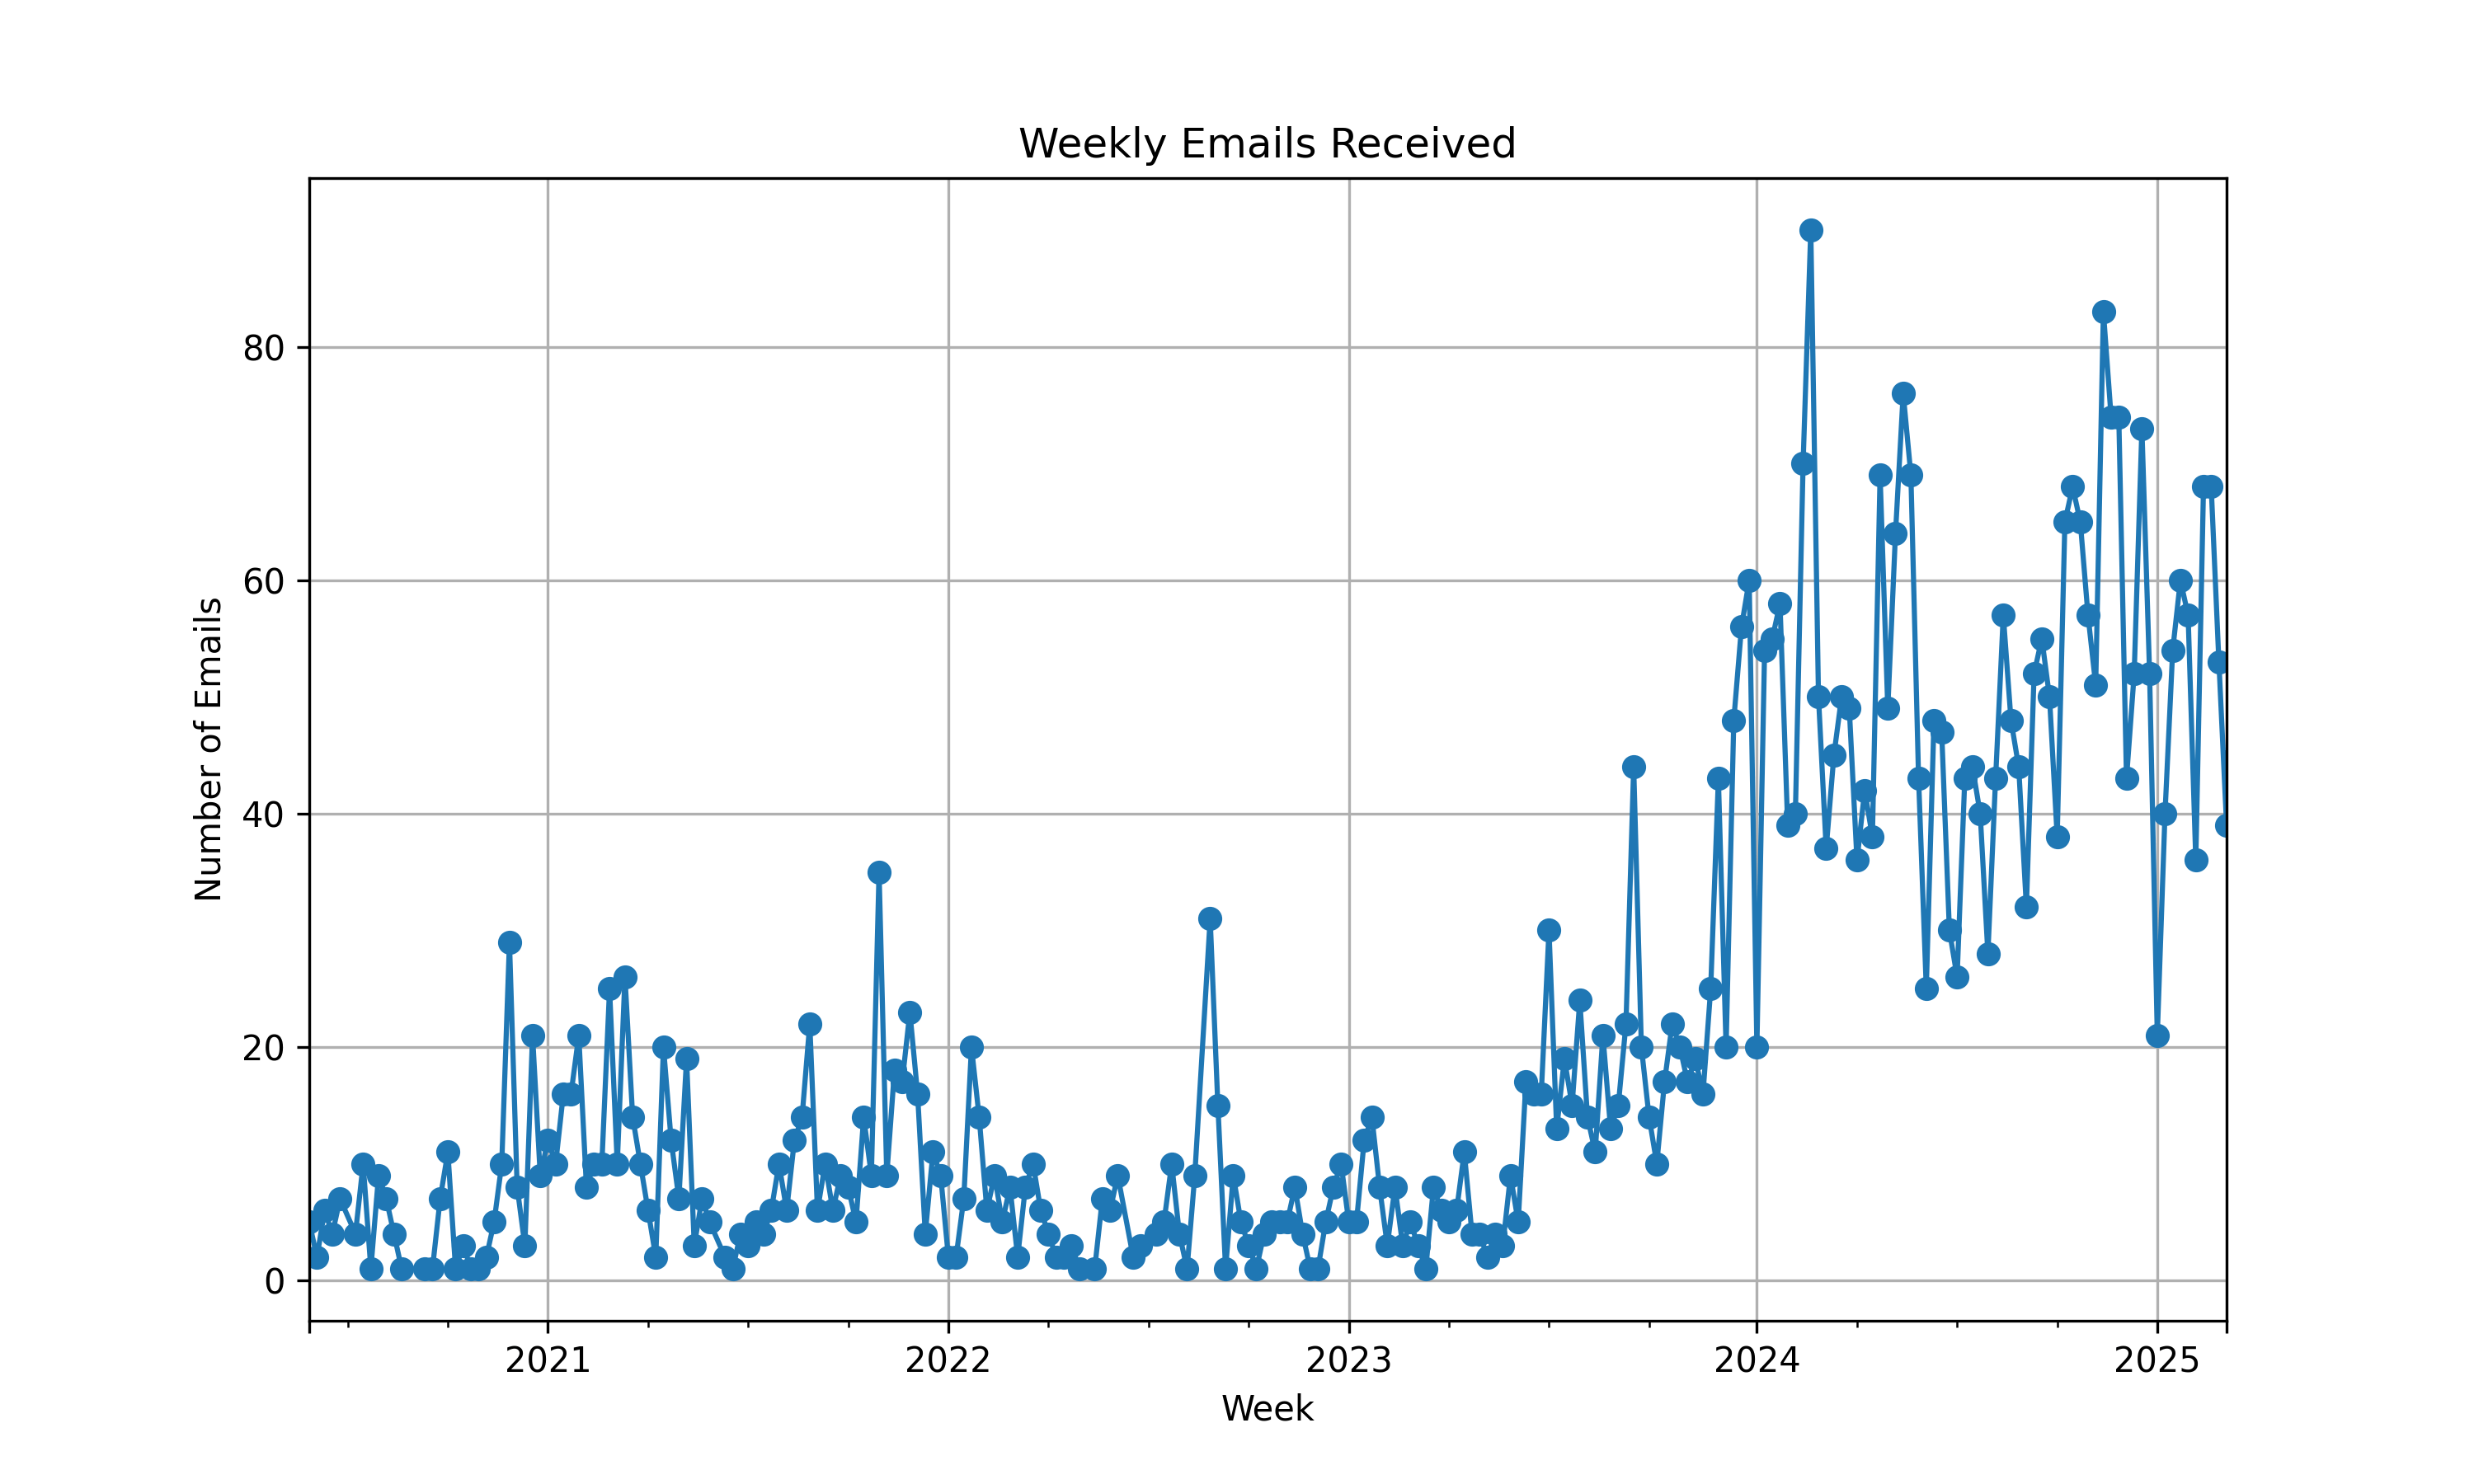
This definitely sounds inaccurate given the amount of emails I’ve been receiving…
To confirm the visible increase in the line chart around mid 2023, I checked my Gmail inbox, and indeed it was in that period that I started subscribing to newsletters.
So I refined the script to only account for weeks starting from mid 2023. These are the new results:
- Emails: 3,768
- Days: 616
- Average: ~6 emails/day
The average makes more sense now, but it’s still not quite there yet. This is because of the variance between the data. My newsletter subscription was not stable yet, it was increasing little by little, slightly skewing the average.
It seems that my inbox reached stability at the start of 2024. So I once again changed the script to account for emails starting from January 1st, 2024, and these are the new results:
- Emails: 3,146
- Days: 431
- Average: ~7 emails/day
Even though my inbox’s total is ~5k emails, ~60% of the emails have been from 2024 onward!
Now I can say with more confidence that I should read ~7 emails/day to keep up with my subscriptions, and a little bit more than that in order to read the ones I missed.
Next, I’ll share the setup and script for anyone interested.
Setup and script for analyzing your inbox data
First, create a Python virtual environment and activate it:
python3 -m venv venv # Or `python -m venv venv`
source venv/bin/activate
Then install the necessary libraries:
pip install mailbox pandas matplotlibFinally, create a Python file, and paste the following script into it:
import mailbox
import pandas as pd
from datetime import datetime
import matplotlib.pyplot as plt

mbox = mailbox.mbox("inbox.mbox")  # Replace with your mbox file name

# Extract email data
data = []
for message in mbox:
    if message["From"] and message["Date"]:
        # Convert email date to a Python datetime object
        try:
            email_date = datetime.strptime(
                message["Date"][:25], "%a, %d %b %Y %H:%M:%S"
            )
        except ValueError:
            try:
                email_date = datetime.strptime(
                    message["Date"][:16], "%d %b %Y %H:%M"
                )
            except ValueError:
                continue

        data.append({"Date": email_date})

# The date the inbox reached stability in terms of newsletter subscriptions
cutoff_date = datetime(2023, 7, 1)

df = pd.DataFrame(data)

# Uncomment the line below to filter emails starting from whatever date you set in `cutoff_date`
# df = df[df["Date"] >= cutoff_date]

total_emails = len(df)

first_date = df["Date"].min()
last_date = df["Date"].max()
total_days = (last_date - first_date).days + 1  # Include both start and end dates

print(f"Total Emails: {total_emails}")
print(f"Total Days: {total_days}")

# Group by week and count the number of emails
df["Week"] = df["Date"].dt.to_period("W")
weekly_emails = df.groupby("Week").size()

plt.figure(figsize=(10, 6))
weekly_emails.plot(kind="line", marker="o", title="Weekly Emails Received")
plt.xlabel("Week")
plt.ylabel("Number of Emails")
plt.grid(True)
plt.savefig("weekly_emails_chart.png")

# Save weekly email counts to CSV
weekly_emails.to_csv("weekly_emails.csv", header=["Emails"])
What a way to spend a Friday. Not gonna lie, this was fun.
As always, I hope you learned something :)